Rain on a dry topic

While I personally am quite interested in ‘Earth, Sun and Moon’, it is one of my least favourite topics to teach in Primary School science. It is to me a ‘dry topic’. It is one of those topics that there seems to be very little actual science you can do with the children. With forces you measure friction on cars down a ramp; with dissolving you can investigate the effect of heat on dissolving salt in water; with health you can measure pulse rate after exercise.

But what can you measure for Earth, sun and moon? Particularly when it has been raining. And it has rained heavily for the last two Wednesdays. Raining on my dry topic.

The planning document that I was working from started with the sentence: “On a sunny day…” Obviously that wouldn’t wash. But fortunately I had some things to help me:

  • A very large ball
  • A tiny bead
  • Some facts
  • Google Docs
  • Brain Pop

The first thing I did was to get the children to predict the relative sizes of the earth and moon, compared to the very large ball I had found in the PE cupboard.

The children initially predicted the wrong relative sizes for the earth and moon

I was pleased to see that the children predicted things wrongly, because it meant I could teach them something. So I gave them some facts – diameters even:

  • Sun = 1390000km
  • Earth = 12500km
  • Moon = 3500km

I then showed them how I could use a Google spreadsheet to calculate that relative to the very large ball of 60 cm diameter, the Earth would be 0.55 cm (Size of sun ÷ Size of Earth x Size of very large ball) and the moon would be 0.15 cm. It took a few moments for the children to realise that 0.55cm was really very small and was only the size of a bead on a bead string. The moon was a sprinkle that you might put on a cake.

Children hold up the correct relative sizes of Sun, Earth and Moon

The sprinkle was particularly difficult to see, but I think it made the point.

I then used Google Docs to work out the relative distance of the Earth from the Sun. The actual distance is 150 000 000km, which means that the relative distance for a 60cm diameter very large ball is about 65m. We paced that out in the corridor, with a teaching assistant holding the Sun in position and the children coming with me to be the Earth. We had to keep 2 sets of double doors open as we did so.

The Sun is a really long way from the Earth

Back to the classroom and how could we use this knowledge? Presented in a Google Doc was the first answer. The children all began their topic presentations to show others what they were learning.

Suzi's slide on the Earth compared to the Moon

Having seen that the children were beginning to get the relative sizes and distances of these celestial objects I wanted to move on to thinking about how the Earth moves round the sun, how it rotates and all that sort of stuff. No here’s where a shadow and some sunlight can be a helpful starting point. Still no shadows – it was still raining. But mercifully someone has invented Brain Pop.

Embedded within our Google Apps domain, Brain Pop is becoming an increasingly valued addition to our learning platform. It is especially exciting for me, being slightly obsessed with spreadsheets and data, because whenever the children finish a test, their score is automatically updated to a Google Spreadsheet that sits within my document list.

Brain Pop working on the school's Chromebooks

Shortly, the children had watched their first video – an effective explanation of the Earth – and were answering questions on it. Soon they had moved on to the phases of the moon. The one flaw in this – I had forgotten to bring any headphones – this meant that the inimitable sounds of Tim and Moby were soon issuing from 30 Chromebooks.

Mercifully, the rain stopped briefly and we were able to go outside and walk a quarter orbit of the sun (the field was a bit too muddy to walk the rest of the way).

You can just about make out "the Sun" in the distance

James and Maruwa were able to demonstrate the moon orbiting the Earth as the Earth orbits the Sun – earlier they had been delighted when watching Tim and Moby’s explanation of the concept: “It’s just like ours,” they exclaimed.

With new-found Brain Pop enthusiasm, I’m hoping that one or two more Brain Pop quizzes will have been completed on related subjects by this time next week. And I really hope the sun shines next Wednesday afternoon.
Good Data: the inspection clincher

Wednesday 14th May was a particularly stunning day for myself. Not only did I finally teach a lesson good enough to be judged ‘outstanding’ by Ofsted, but the data that I produced also helped us do well in the inspection overall.

First, some context. Ofsted are the National body in the UK that inspects state-funded education. Recently (January 2012) a new inspection framework was produced that streamlined some 22 categories into only 4. Consequently, we had begun hearing some horror stories of many schools in our area moving down a category – it seemed it was harder to average out at the same grade you had previously been on. Ofsted judges schools in one of 4 ways: 1 – Outstanding, 2 – Good, 3 – Satisfactory and 4 – Inadequate.

Of course, our fears were that we would move down a category, losing our good status to take on that dreadful label – ‘satisfactory’. It was not to be. We came out as a ‘Good’ school and the report reads particularly well (I think).

So what of the data?

Well, we knew in our hearts that we do a good job for our children. The school is set in a part of Birmingham within the highest 20% of deprivation in the country. The children enter the school well below average and leave the school broadly in-line with national expectations, but how could we prove that in numbers?

It was a function and 3 Google Spreadsheets that came to the rescue.

I keep tracking sheets for reading, writing and mathematics for all students and looking at them, I could see that the children who we’ve taught for a while achieve better than those who’ve just joined us. In other words the children we teach, do well; we have a small but significant group of children who join us late and don’t make as much progress.

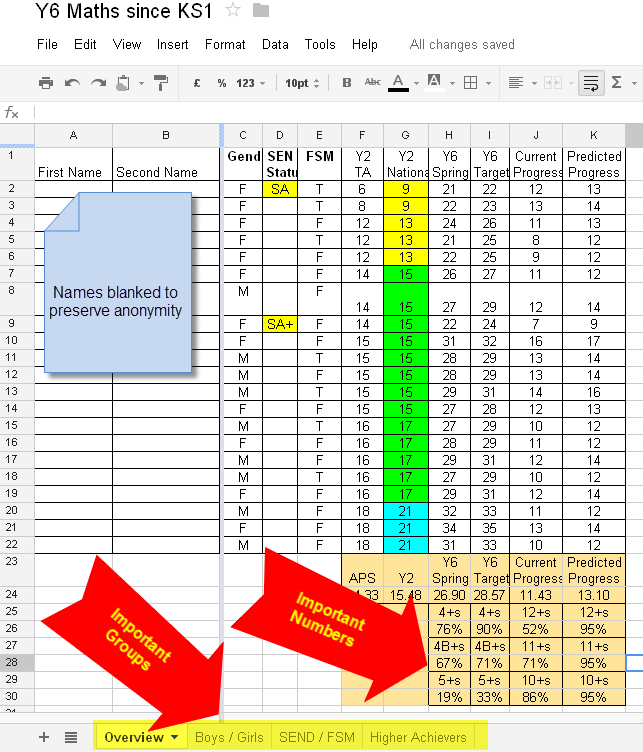
One of the data sheets that impressed the Ofsted inspectors

So I used my Google Spreadsheets to calculate a range of measures from current attainment in each subject, to the progress being made. The function that helped me the most was the ‘countif’ function  – I’d recommend finding out how it works if you don’t already – there’s guidance within both Excel and Google Docs.

I used the countif function to help me calculate 12 important numbers for each group – overall, boys, girls, SEND (special educational needs or disabled), FSM (free school meals) and higher achievers. This data showed that all groups who had been taught by us through the Key Stage 2 department (ages 7 to 11) were achieving at or above national expectations

In addition, a second sheet showed that in each year group, progress in reading, writing and maths was good or outstanding.

Sample of the progress data for each year group (if you’re a UK education data guru, you’ll understand what those numbers mean.

In all, I used the spreadsheets to calculate 363 separate numbers to demonstrate to Ofsted that we are still a good school.

I was helped in this process because we use an assessment system called Incerts, which fills up my spreadsheets with meaningful numbers from teacher’s assessments. Once we demonstrated that our monitoring of this assessment was effective by analysing current samples of teacher assessments in books, the inspection team were content to believe that our data did indeed demonstrate that we are doing a good job for our children.

And next time we’ll be ready to argue for ‘outstanding’.

Google Docs and the “Ofsted Outstanding” Lesson

It has taken 15 years and 8 Oftsed inspections, but I have finally achieved an Outstanding lesson at Ofsted.

For those people not from the UK, Oftsed is the national body that inspects state-funded education, and ‘Outstanding’ is the highest grade they give.

I’m aware that I could be answering the question “why has it taken you so long?” Or “what on earth have you be doing all this time?” But instead I’m going to tell the story of how I achieved outstanding.

It began the day before when the lead inspector briefed the staff. Gathered in the staff room, sweaty palms and hearts thumping, he introduced himself and went on to give us some friendly advice.

“Just be yourself,” he assured, in his soft Welsh tones. “Perhaps now is not the time to try that experimental drama lesson you’ve been wondering about, but if you were going to take a risk, then take it. Just be yourself.”

At this point the teaching assistant I was working with looked nervously across it me. Not only does my teaching demonstrate a tremendous lack of risk-aversion at times, but I had already planned some experimental drama that week. And the teaching assistant was leading it. And it was in a maths lesson.

The second piece of advice the lead inspector gave us (and I would recommend this to anyone about to undergo an inspection) was to do a ‘mini-plenary’ as the inspectors walk into the room. Inspectors used to watch whole lessons, but these days their time is so tight, they can generally only see half-an-hour chunks. A mini-plenary is where you would stop the activity or whatever was going on, check on how much the children have learned, remind them what they were aiming to show they had learned by the end of the lesson before proceeding with the rest of the session. The idea is to show the inspectors that progress has been made (even though the inspectors might not have seen it) and more progress is still expected. Inspectors get very excited when they see progress.

Of course I didn’t follow this advice either. Experimental drama and no mini-plenary? And I have the cheek to call myself a teacher.

Maths apparatus the inspector saw: cups on a stringMore of what the inspector saw: cards on the wall

Admittedly, the lead inspector was a little bemused when he walked into my room. Or so he told me afterwards.

It was 9:30am on the second day of the inspection. The lesson was half an hour old and the inspector could see:

  • one student playing shops with the teaching assistant;
  • another student playing dominoes with myself;
  • assorted apparatus scattered on the floor;
  • fraction cards stuck to the wall;
  • the rest of the students intently staring at the screens of their Chromebooks.

Half an hour later, when he walked out he said one word to me. “Stunning.”

So what had turned a potential mess of different activities into a ‘stunning’ outstanding lesson?

Answer: Google Docs

You see, Google Docs had enabled me to have high quality interactions with three different groups of learners, using only two adults. Here’s how.

Group 1: The experimental drama

I have some children within the class who, despite being eleven years old and nearly at secondary school, have great difficulty remembering maths facts and them applying them to real life situations. They just don’t get the link. Hence the maths role play area.

The week before we had set up a ‘stationery shop’ in the classroom – everything was priced from pencils to sparkly sharpeners. With the teaching assistant as the shopkeeper their task was to choose items for less than a set amount, say £10 – then work out how much they would have to pay and how much change they would get. The teaching assistant is particularly good at teaching the children how to add up quantities with differing amounts of digits, like £3, £1.15 and 45p – something that often causes confusion.

By the time these sort of children get to eleven years of age, they have often labelled themselves as maths failures. For them, maths become a grey despair. The drama adds a light-hearted element to their maths learning. Enjoyment brings engagement, engagement leads to motivation and motivation accelerates learning. The inspector was impressed by the motivation of these lower-attaining children and recognised that it was accelerating their progress.

Group 2: The dominoes game

Some of my children don’t know any games. Draughts, Monopoly, chess – they’re all a mystery. We have some marvellous versions of dominoes that are brilliant at showing the equivalence between fractions, decimals and percentages. However for many of the children I can’t use the game because the very act of playing dominoes is too much of a barrier.

In this lesson I was able to use dominoes 1:1 because the Google Docs (which I’m coming too) enabled me to. The advantage of playing dominoes with a child 1:1 not only could I support them with the game, but when they were stuck finding an equivalent for the dominoes in their hand, I could unpick their misconceptions and teach them the concepts. For me, a 1:1 interaction with a student provides the best moments of teaching and hence the most powerful learning. The inspector was impressed that I’d planned time for these 1:1 interactions to take place.

Group 3: The Google Docs

Different children represent two fifths on a Google Doc

Often, whilst a teacher works with a small group or an individual, the rest of the class complete tedious worksheets or engage in something known as ‘group work’. Not with Google Docs.

Each child worked individually on a small part of a Google Drawing to represent what different fractions would look like. This particular group of children need lots of concrete examples to help them understand the abstractness of fractions. Showing a child the digits ¾ is often not enough – children need to represent it with apparatus and images. In this case the children demonstrated to the inspector when he spoke to them that they were really understanding fractions in a way they hadn’t previously.

The five sixths drawings prompted most discussion in the plenary
The three eighths representations

Moreover, when the students were stuck, they contacted me via chat. So instead of shouting out (and disrupting their peers), or bringing their work over to me as the teacher (and thereby disrupting the domino game), they were able to silently ask questions of me.

I had opened  4 Chromebooks on the table next to me, each displaying one of the fractions Google Docs that different children were using. Two fifths had the most activity, but other children attempted five sixths and three eighths.

The inspector was particular impressed that the children supposedly on an ‘independent activity’ still had the means to seek adult support, and therefore be taught, rather than spending the whole lesson being stuck. And the Google Docs chat feature minimised the disruption to other learners.

The Google Docs them prompted some excellent discussion at the end of the lesson, particularly the five sixths pictures, which two students had drawn incorrectly. Each had drawn five sevenths instead of five sixths. The discussion in the plenary draw out their misconceptions and we were able to correct them collaboratively on the Chromebooks.

Google Docs had enabled both myself and my teaching assistant to work more effectively as teachers – to spend more of our time actually teaching. As a consequence the children were motivated and enjoyed their learning and so the inspector could only see outstanding progress being made during the lesson.


There’s an easy way of doing this

In the run up to the National tests for eleven year olds called SATs this May, I was practising with some of my pupils what some of the question would look like.

The girl looked at the question and said: “there’s an easy way of doing this.”

The question said 56 ÷ 4 =

It is one of those rare questions in a Key Stage 2 SATs paper that requires a simple answer to a mathematical expression. The girl I’m sure had seen that question every year for the last five years. Yet she was still hesitant – she had no instant response to the question. She had to think of the ‘easy way‘. And unfortunately she went on to choose the wrong easy way.

“My teacher told me you just drop the ‘6’ off the end, add one on to the 5 and that’s the answer.” Unfortunately the girl was remembering the ‘easy way’ for dividing by 9. And she was remembering the answer to the expression 54 ÷ 9 (which of course is 6).

This one of the reasons I dislike teaching children easy ways of doing things. In my experience most children who are taught easy ways have learned the underlying principles behind them. They then can only remember a small number of many easy ways and eventually they forget which way is which and when to use it. The next step is to decide that they can’t do mathematics anymore and they switch off from the subject altogether.

To quote a biblical metaphor, it’s a bit like building your house on the sand. It only takes a single storm of confusion to reveal that there were no foundations and everything is washed away.

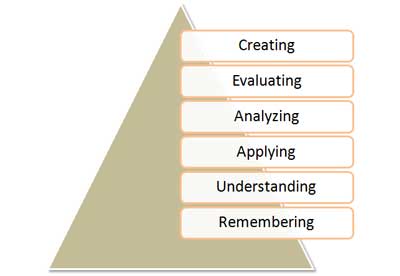
Putting it another way, it’s like badly applying Bloom’s taxonomy to teaching. It seems we’re very keen in the teaching world at the moment to find ways of teaching those higher skills of evaluating and creating. But we miss the vital step between remembering things and applying them – that of understanding them.

We teachers often talk about that ‘wow’ moment in lessons – that realisation by the students that they are really ‘getting it’. This most often happens in 1:1 interactions but can also happen with larger groups. When I look at the Bloom’s Taxonomy chart I would say that that ‘wow’ moment comes in the ‘understanding’ phase. It’s not when we’re sure children can remember things by heart, or when we see them diligently applying their knowledge, nor even we see the outcome of a great piece of creativity. It’s when children comprehend, when you can look into their eyes and know they have understand – when they get it.

So, back to the girl with the maths problem.

Striving for that moment of understanding, I asked, “are you sure that’s how to divide by 4?”

She looked at the problem, hesitated for a moment and said. “Oh no. There’s an easy way to divide by 4. Halve it and halve it again.”

I couldn’t argue with that process. She proceeded to halve 56 by writing down 2.5 and 3. Then she wrote 2.8 in the answer box. I almost slapped my forehead in despair.

After a few more minutes of remembering how to halve, she did eventually get to the point where she found that half of 56 was 28 and then half of 28 was 14. She wrote that in the answer box.

Not satisfied, I asked her, “what if it had been 56 ÷ 6? How could you have done that?” She looked at me, blankly. I think that she was a little disappointed that even though she had arrived at the correct answer I hadn’t showered her in praise.

Divide by 6? I don’t have an easy way for that.” OK. She didn’t actually say those words, but I’m sure she was thinking them.

So I showed her the number line in the photo below. I showed her how you could count up in 4s or in groups of 4 to arrive at the answer. I showed her how it would also work for dividing by 6 or dividing by 7.

Trying to teach understanding, not just an easy way

I didn’t really get that ‘wow’ moment I was hoping for. I think she begrudgingly accepted that maybe the number line had some merits. Of course counting up in this way requires good recall of times table facts – facts that she struggled to remember.

It is interesting to me that the first stage on Bloom’s Taxonomy of remembering seems to have been pirated away for this particular student. Where she couldn’t initially remember to halve and her poor recall of times tables facts limited her approach to this question, she could, by contrast, remember quite well that there are some ‘easy ways‘ for doing things in maths. This in turn limited her understanding of the principles of division and stopped her applying any knowledge she had to this problem.

It seems to me then that we need to stop teaching tricks and easy ways that fill up children’s memories. We need to teach children to recall and remember important facts first, such as how to halve and double and times table facts. Then we need to teach children understanding, such as what division is – that it is both grouping and sharing (depending on the context). Then we can give them opportunities to apply their knowledge.

What’s being abused here – the teachers or the data?

I was surprised to see the report on the BBC a few days ago about teachers being abused online. Surprised for two reasons – firstly the headline statement read that over 4 in 10 teachers had been abused online by pupils or parents and secondly that I had contributed to the NASUWT online survey which generated the results.

The email I received from the NASUWT

I was pleased to receive the email, because we’ve begun to have some highly positive experiences with Facebook at my school. I wanted to share them.

We had encountered some unpleasant Facebook incidents some two years ago and so had decided to set up our own Facebook page. It may be just good luck, but it seems that merely having a Facebook presence has deterred any pupils or parents from saying anything inappropriate. Both pupils and parents refer to the page to find out what’s going in school – maybe that has ameliorated their language on the platform.

Anyway – I know that one swallow doesn’t make a summer, so I was hoping by contributing to a big online survey about social networking that a growing number of schools who are using Facebook positively might be discovered and reported on. Nope. Not this time. There was nowhere to record number of times abused = 0. There was nowhere to record positive statements about social networking sites.

It seems that just by filling in the survey I was recording that I had definitely been abused online by either parents or pupils or both.

But if that’s the case I don’t get where the 4 in 10 teachers comes from. You see only about half the teachers in the country belong to the NASUWT. Even during the strike ballot last year less than half of those voted – I can’t imagine that more teachers would respond to an online survey than vote over striking over pension changes.

Furthermore, looking at the BBC report I can see no reference to the data of the survey, no methodology. There’s no numbers saying how many people were actually questioned (I’ve no way of knowing whether it was the online survey I took part in that generated these numbers). The BBC have previous on this. Back in August 2011, they took a report from Plymouth University by Professor Andy Phippen to claim that 35% of teachers have been bullied online. Again there’s no numbers. 35% of teachers sounds bad – but if only 20 teachers have been questioned, it’s not much of a survey.

Delving further, the Andy Phippen survey exists, but again its methodology is questionable. We finally have a number of responders – 377:

In total 377 people responded to the survey, providing a solid, broad base for the
rest of the research. (p4)

We discover that these responders have answered an online questionnaire which they were sent to via ‘teaching mailing lists’ (p3) – although that still doesn’t tell us by which criteria each mailing list was generated.

The crunch for me comes with the question that generates the 35% of teachers have been abused online. I was expecting to see some words akin to:

Have you ever been subjected to any online abuse?

But instead I see the question:

Have you or colleagues ever been subject online abuse?

Or your colleagues? Or your colleagues? What on earth does that do to the data? I work in a small Primary school. Aside from ‘my colleagues’ from other schools that I work with, I have 30 colleagues from solely my school. Given that my school could be about average (and it certainly isn’t), my one vote actually counts for 30. That means each of the 377 responders to this survey are actually answering the key question, not for themselves but for 10, 20, 30 maybe 100 or more colleagues. If we average at 30 that means that there are actually 11310 people in the survey. And 117 out of 11310 as a percentage is 1.03%

So 1% of teachers have been abused online.

Don’t get me wrong, that is still a terrible number. With nearly a million teachers in the country, that means there are over 10000 of us who’ve gone through the pain of online abuse. It’s great that the government funded Safer Internet Centre exists to provide counselling and support for those teachers and strategies to reduce online bullying in the future.

But that’s not the issue here. The issue is that bad data has been used to create a statistic that just isn’t right. Now I’ve got no way of knowing the actual number of educators who have been abused in the sample of 377. The minimum number is 117, because that is how many have been reported. It could, of course, go much higher, but the questioning in the Prof Phippen survey isn’t good enough to find that out.

At least, to give Prof Phippen some credit, his survey does actually have the sample size in it. No joy from the NASUWT survey. The press release about the survey just tells us that  42% of those responding to the survey reported online abuse.

Hang on! “Of those responding?” “Of those responding?”

Again. That could be 42% of 50 people, making the survey next to meaningless. But now think back to the survey – it was a survey of online abuse – there was no opportunity to report ‘no abuse’. And only 42% of those responding said they had been abused? In a survey where you can only say “Yes I have been.”

This quite simply is at best bad data, and at worse is plain lying. And of course the BBC and other reputable news media such as Channel 4 here, and the Independent here are completely taken in by it.

To be fair to the Independent they did interview Chris Keates to find that 1200 teachers had responded to the survey, but nobody asked about the questioning. With around 300 000 members, a response of less than 3000 is again in that ball park area to indicate that about 1% of teachers have experienced online abuse.

For the last time, online abuse of teachers is a terrible thing, but we’re not going to fix it by inaccurate data and sensationalised headlines during conference season.

Yes: schools should be fined for not teaching reading

So, the recent report on the Summer 2011 riots recommended that schools should be fined for not teaching reading. I agree.

Michael Bond, the author of the much loved Paddington Bear, was on the BBC on Monday morning. He said that the two most important things you can do with children are spending time with them and teaching them to read. He went on to say that reading must start in the home.

And for many families this is the case. Reading does start in the home. Children are exposed to books from birth. They are read to every night. They understand which way to turn the pages and which way to read the script. They may even recognise a few words.

However this is not the case for all families. For some children their first exposure to books is at school. For a sizeable minority in my school this is the case. And for many more, whilst the children still have had some exposure to books, they still enter school behind the national average for reading.

In my school we have to teach reading. Merely giving the children a home reader and hoping doesn’t work. The children have to be taught how to read from scratch.

In contrast, at the school where my own children go, less teaching of reading is needed. This is because in general the children enter the school more able to read and continue with more home support of reading as they progress through the school.

Yet funding is more or less the same. Yes, my school probably does pick slightly more special needs funding, but it is for the few children who are a long way below the national average, not those who are slightly behind. And despite that, the teaching of reading at my school really works. Where nearly 80% of the children enter the school behind the national average, less than 20% leave the school behind the national average.

We taught reading well to a lot of children.

I suspect the measure being suggested by the panel that investigated the Summer 2011 riots would suggest fining schools like us for allowing some children to leave us at a standard that is lower than the national average. But wouldn’t be great if it was a measure that rewarded schools who actually teach reading and don’t just leave it up to supportive parents.

Whisky Tour Day 3

The sun rose on another splendid morning in Islay, highlighting the underside of the clouds in a marvellous rippling pattern. I should have taken a picture. But I didn’t and half an hour later the sea fog, or ‘haar’ as they call it around these parts, had rolled in. 4 seasons in one day? It can be 4 seasons in two hours in Islay.

Still that didn’t dampen the enthusiasm for distilleries and 3 more were on our agenda for today. We began with Bowmore – the oldest on the island. The tour was very informative but unfortunately they’re very secretive about their processes and we weren’t allowed to take any photos beyond the maltings – 25% of which are made on site.

I tasted a pleasant dram of 12-yr old Bowmore overlooking the shores of Loch Indaal – a really stunning place to drink whisky.

Our next stop was Bruichladdich, but with some hours to kill before then, we stopped on the Islay Woollen Mill – an amazing operation in a stunningly beautiful setting and patronised by royalty. My wife bought me a jumper.

The Islay Woollen Mill is set in a stunning location

It really is a great place to visit to see a master craftsmen at his traditional best.

Our guide then took the cunning choice to walk the mile and half to Bridgend for lunch. A good idea on the face of it, even the dram of 12-yr old Bowmore we took half way couldn’t disguise the muddiness of the path, nor the wetness of the drizzle. Both of these things preceded our bedraggled arrival at the Bridgend Hotel, which I can say, serves both excellent food and excellent whisky.

Our next distillery stop was Bruichladdich. A relatively new distillery having re-opened ten or so years ago, this place boasts an overwhelming range of different whiskies – almost too much too choose from. However when I tasted the heavily-peated, 9-year-old, wine-cask-finished Port Charlotte and then discovered I had the chance to bottle my own  – I just had to go for it. I was also impressed with the Octomore 4.2 and came away with a bottle of  that too.

Some colours from Bruichladdich

Kilchoman was a last distillery on the tour. Having started in 2006, it only has very new malts, but both that we tried were really pleasant. The 5-yr old bourbon-cask was heavily peated, but excellent, and the 5 yr-old sherry-cask was much richer, but with an equally long peaty aftertaste – my favourite sherry finish that I had tried thus far.

Now there remains a ferry trip and a stop at Loch Fyne whisky shop on the morrow.

Whisky Tour Day 2

A short ten miles from Bowmore this morning and we were in Port Ellen. Once home to its own distillery (and still sadly mourned by some), Port Ellen now only hosts a ferry terminal and a huge maltings house that supplies many of the distilleries on the island. It is also the gateway to the big three – Lagavullin, Ardbeg and Laphroig.


The mighty Lagavullin distillery

Our first stop was Lagavullin. There we met the effervescent Ian, who I had first read about in Michael Jackson‘s mighty tome: “Whisky”. In his fortieth year at Lagavullin, Ian led us through a tasting of various Lagavullins, from the regular 12-year old, through a 15 yr old, 19 yr old, 46 yr old and then a double matured. While it was a treat and a privelege to hold a glass of nearly 50 yr old whisky, I wasn’t that impressed with the taste and much preferred the 15 yr old and the 19 yr old. However it was then both amusing and frustrating to hear Ian tell us with garrulous charm that there was nowhere we could buy the 19-yr old – it had all run out.

It might not look like much, but this could cost £50 a glass!

Ardbeg was our next stop. After lunch there we went into a room with Jackie for a tasting of different Ardbegs. All of them I liked, preferring Ardbeg over Lagavullin, but my very favourite was a variety called Corryvreckan, named after a large whirlpool that develops between Islay and Jura in certain conditions. For me it contained just the right bend of smokiness, bitterness and body, although maybe I’d be better off describing it when I taste it by itself and not after a few drams of Lagavullin.

The tasting room at Ardbeg

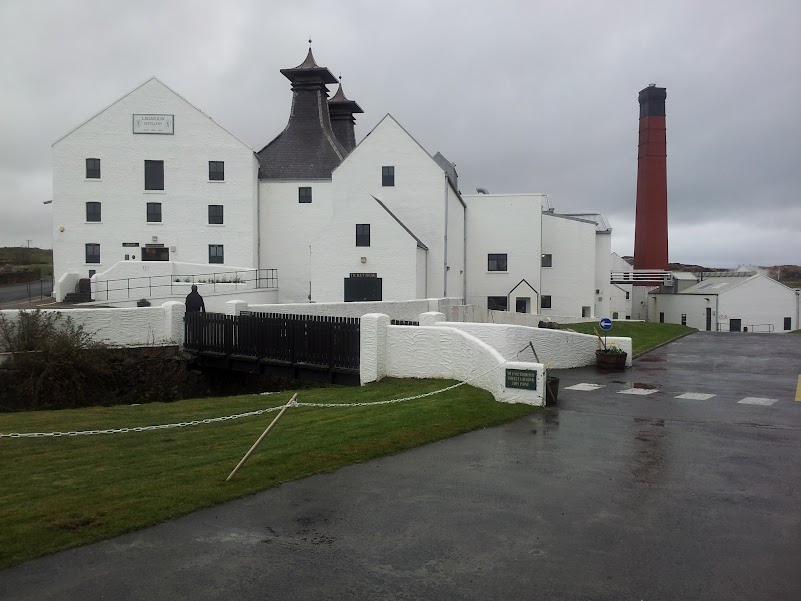
Our third stop of the day was Laphroig. It was another amazing place with a good tour and a splendid tasting room, although at this stop we only sampled one variety of Laphroig. It was great to see the maltings in operation at Laphroig – they use 15% of their own malted barley – the rest come from the big maltings in Port Ellen.

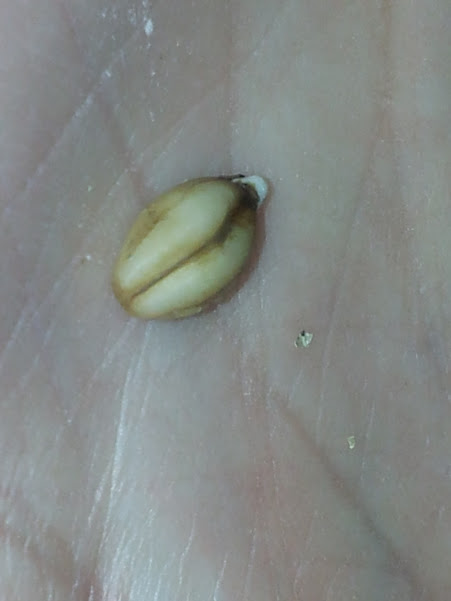
A barley grain showing that first sign of a root.

It had been Laphroig who, earlier in the day, we had seen cutting the peat bogs on the road to Port Ellen. This is an operation they still do in a traditional style, by hand and using no machinery other than hand tools on the turf. Perhaps this is a reason why Prince Charles chose to bestow his Royal Mark on Laphroig some time ago – he’s also been one for believing in natural, traditional methods. Or maybe he just likes a wee dram of Laphroig.

The stills were impressive too, pumping out their spirit at a fast rate.

The stills at Laphroig

With Laphroig done our touring was over for the day. Tomorrow we sample Bowmore, Bruichladdih and Kilhoman. Should be interesting.

Whisky Tour Day 1

Auchentoshan was our first stop on the whisky tour. Just outside Glasgow, the tour is well-organised and quickly takes you through the essentials of whisky production. Our guide, Ali was knowledgeable and friendly, even if the noise of this fully-operational whisky distillery made it difficult to hear at times. Our guide at Auchentoshan

The whisky was certainly colourful. The difference from the 6 year old to the 21 year old made a splendid display.

The Colours of Auchentoshan

And it tasted splendid too.

A wee dram of Auchentoshan

There followed a long drive. The countryside was marvellous – beautiful views of Loch Lomond, followed by Loch Awe. However the quality of the road and the quantity of the roadworks (too features which must be somehow linked) put a dampener on the beautiful sights.

We stopped on the way in Oban, for lunch and briefly popped into the distillery there. We stopped briefly at Kilmartin and saw it’s ancient church, Cetlic Cross and grave carvings. We also stopped at Tarbert where once Viking lords had pulled their longships across the land to claim the Mull of Kintyre.

Finally we were on the ferry to Islay. The light coming through the clouds was stunning, and the brand new ferry meant for a very pleasant crossing.

Now tucked up in bed next to Bowmore distillery, I’m looking forward to a trip to the peaty ‘Big 3’ on the south part of Islay tomorrow.


  • Social Slider